
As data plays a crucial role in decision-making and data-driven insights, organizations require a robust data governance framework to manage and monitor their data assets. Power BI offers various features and tools that aid in implementing data governance and ensuring data accuracy, reliability, and security.
As data becomes increasingly critical to organizations of all sizes and industries, managing this data effectively and securely becomes just as important. A crucial aspect of data management is data governance, which is defining and enforcing policies, procedures, and standards for data management. This article will explore data governance basics, how to implement it in Power BI, and the advantages of using Power BI Premium.
What is Data Governance?
Data governance is the set of processes, policies, and standards organizations use to manage their data effectively. It encompasses everything from data quality and security to data privacy and retention. Effective data governance is crucial for organizations to ensure that their data is accurate, secure, and accessible. In addition, it helps organizations make informed decisions, reduce risks associated with poor data quality, and maintain compliance with legal and regulatory requirements.
How to Implement Data Governance in Power BI
Power BI provides various features and tools to help implement data governance. These include Dataflows, Datamarts, Sensitivity labels, Endorsement, Discovery, and Row-Level-Security(RLS). Dataflows allow organizations to connect, clean, and transform data, while Datamarts provide a centralized data repository. Sensitivity labels help to classify and protect sensitive data, while Endorsement allows organizations to enforce data quality standards. Finally, Discovery helps organizations manage, monitor, and understand their data assets. Let’s explain each of them.
Dataflows
A dataflow is a collection of tables created and managed in workspaces in the Power BI service. A table is a set of columns used to store data, much like a table within a database. You can add and edit tables in your dataflow and manage data refresh schedules directly from the workspace in which your dataflow was created.
As data volume grows, so does the challenge of wrangling that data into well-formed, actionable information. We want data ready for analytics to populate visuals, reports, and dashboards, so we can quickly turn our volumes of data into actionable insights. With self-service data prep for big data in Power BI, you can go from data to Power BI insights with just a few actions.

When to use dataflows
Dataflows are designed to support the following scenarios:
Create reusable transformation logic that many datasets and reports inside Power BI can share. Dataflows promote the reusability of the underlying data elements, preventing the need to create separate connections with your cloud or on-premises data sources.
Expose the data in your Azure Data Lake Gen 2 storage, enabling you to connect other Azure services to the raw underlying data.
Create a single source of truth by forcing analysts to connect to the dataflows rather than connecting to the underlying systems. This single source gives you control over which data is accessed and how data is exposed to report creators. You can also map the data to industry standard definitions, enabling you to create tidy curated views, which can work with other services and products in the Power Platform.
Suppose you want to work with large data volumes and perform ETL at scale; dataflows with Power BI Premium scale more efficiently and give you more flexibility. Dataflows support a wide range of cloud and on-premises sources.
Prevent analysts from having direct access to the underlying data source. Since report creators can build on top of dataflows, it might be more convenient for you to allow access to underlying data sources only to a few individuals and then provide access to the dataflows for analysts to build on. This approach reduces the load to the underlying systems and gives administrators finer control of when the systems get loaded from refreshes.
You can use Power BI Desktop and the Power BI service with dataflows to create datasets, reports, dashboards, and apps that use the Common Data Model. You can gain deep insights into your business activities from these resources. Dataflow refresh scheduling is managed directly from the workspace in which your dataflow was created, just like your datasets.
Click here to learn how to create a Dataflow in Power BI.
Datamarts
Datamarts are self-service analytics solutions that enable users to store and explore data in a fully managed database.

When to use Datamarts
Datamarts are targeted toward interactive data workloads for self-service scenarios. For example, suppose you’re working in accounting or finance. In that case, you can build your data models and collections, which you can then use to self-serve business questions and answers through T-SQL and visual query experiences. In addition, you can still use those data collections for more traditional Power BI reporting experiences. Datamarts are recommended for customers who need domain-oriented, decentralized data ownership and architecture, such as users who need data as a product or a self-service data platform.
Datamarts are designed to support the following scenarios:
Departmental self-service data: Centralize small to moderate data volume (approximately 100 GB) in a self-service fully managed SQL database. Datamarts enable you to designate a single store for self-service departmental downstream reporting needs (such as Excel, Power BI reports, and others), thereby reducing the infrastructure in self-service solutions.
Relational database analytics with Power BI: Access a datamart’s data using external SQL clients. Azure Synapse and other services/tools that use T-SQL can also use datamarts in Power BI.
End-to-end semantic models: Enable Power BI creators to build end-to-end solutions without dependencies on other tooling or IT teams. Datamarts eliminates managing orchestration between dataflows and datasets through auto-generated datasets while providing visual experiences for querying data and ad-hoc analysis, all backed by Azure SQL DB.
Click here if you want to know how to create a Datamart.
Sensitivity labels
A Sensitivity label is an information icon that users can apply in the Power BI Desktop or the Power BI Service. They are essentially digital stamps that can be applied to a resource to classify and restrict critical content when shared outside Power BI.

Click here if you want more information about implementing sensitivity labels.
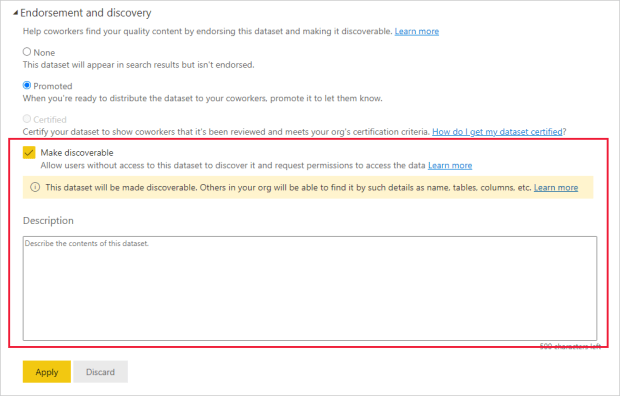
Endorsement
Power BI provides two ways to endorse your valuable, high-quality content to increase its visibility: promotion and certification.
Promotion: Promotion is a way to highlight the content you think is valuable and worthwhile for others to use. It encourages the collaborative use and spread of content within an organization.
Any content owner and member with write permissions on the workspace where the content is located can promote the content when they think it’s good enough for sharing.
Certification: Certification means that the content meets the organization’s quality standards and can be regarded as reliable, authoritative, and ready for use.
Only authorized reviewers (defined by the Power BI administrator) can certify content. Content owners who wish to see their content certified and are not authorized to certify it themselves must follow their organization’s guidelines about getting their content certified.

Click here to learn how to endorse your content in Power BI.
Dataset Discovery
The Power BI dataset discovery hub empowers Power BI and Microsoft Teams users to discover and re-use organizational and curated datasets and answer their business questions in Power BI or Excel. The hub will empower data owners to manage their assets in a central location.
Click here to learn more about dataset discovery.
Row-Level-Security (RLS)
Row-level security (RLS) with Power BI can be used to restrict data access for given users. Filters restrict data access at the row level, and you can define filters within roles. In the Power BI service, members of a workspace have access to datasets in the workspace. RLS doesn’t restrict this data access.

Click here to learn more about Row-level security
What Is Self-Service in Power BI?
Self-service business intelligence (BI) is a data analytics method that allows business users (e.g., business analysts, managers, and executives) to access and explore datasets without experience in BI, data mining, and statistical analysis. Users can run queries and customize data visualization, dashboards, and reports to support real-time data-driven decision-making.
Power BI offers robust self-service capabilities. You can tap into data from on-premise, and cloud-based data sources (e.g., Dynamics 365, Salesforce, Azure SQL Data Warehouse, Excel, SharePoint), then filter, sort, analyze, and visualize the information without the help of a BI or IT team.
Using the Power Query experience, business analysts can directly ingest, transform, integrate, and enrich big data in the Power BI web service. The ingested data can then be shared with other users across various Power BI models, reports, and dashboards.
How vital is Self-Service in Power BI?
In many businesses, productivity and agility suffer due to a lengthy process for BI-related data requests. For example, when Alice asks Bob a question, Bob has to wait for the BI/IT team to pull the data. This can take several weeks and multiple meetings, slowing the decision-making process.
But with Power BI self-service, Bob can quickly retrieve real-time data, and Alice can immediately drill down into relevant datasets during the first meeting. This results in a more efficient discussion and a potential solution that can be implemented immediately.
The significance of Power BI self-service goes beyond just real-time insights, collaboration, and data reuse. It helps business users develop the habit of relying on data when making decisions. Without easy access to data analytics, they may rely on instincts or experience, leading to suboptimal outcomes. But with real-time data at their fingertips, users can make data-driven decisions, establishing a pattern of data-informed decision-making.
Implementing Effective Data Governance in a Power BI Self-Service Environment
Data Governance is critical in implementing a self-service culture in Power BI as it provides a framework for defining, maintaining, and enforcing data management policies. The following are critical components of a data governance plan in Power BI:
- Data Quality: Define data quality and accuracy standards to ensure that the data used is reliable and trustworthy.
- Data Security: Implement security measures to ensure that sensitive data is protected and only accessible by authorized users.
- Data Lineage: Define the lineage of the data sources used in Power BI to ensure that the data can be traced back to its source.
- Data Ownership: Assign ownership of data sources and ensure that data owners are responsible for maintaining the accuracy of their data.
- Data Stewardship: Designate data stewards responsible for maintaining data quality and ensuring compliance with data management policies.
- Data Access Control: Implement access controls to ensure that only authorized users can access sensitive data.
- Data Auditing: Implement auditing and monitoring processes to track changes to the data and ensure compliance with data management policies.
By implementing these key components, organizations can establish a strong foundation for a self-service culture in Power BI while ensuring that the data is secure, accurate, and trustworthy.
Maximizing Your Data Governance with Power BI Premium
From scalability to security, Power BI Premium offers a range of features that can help organizations manage their data more effectively. With dedicated capacity, IT departments can ensure consistent performance for their teams. Advanced security features also guarantee data privacy and protection. Follow below the ten advantages of implementing data governance with Power Bi Premium:
- Scalability: Power BI Premium can handle large amounts of data and high concurrent usage.
- Dedicated Capacity: Dedicated resources for Power BI Premium ensure consistent performance.
- IT Governance: IT departments can centrally manage and govern Power BI deployments.
- Data Privacy & Security: Advanced security features ensure data privacy and protection.
- Shared Workspaces: Teams can collaborate on data and reports in a secure environment.
- Unrestricted Data Sources: Power BI Premium supports a broader range of data sources than Power BI Pro.
- Dynamic Row-Level Security: Secure access to sensitive data can be managed dynamically.
- On-Premises Data Connectivity: Power BI Premium supports connectivity to on-premises data sources.
- Long-Term Data Retention: Power BI Premium enables organizations to retain data for extended periods.
- Lower TCO: Power BI Premium can provide lower total ownership costs than purchasing individual Power BI Pro licenses.
10 Effective Strategies for Implementing Data Governance in Power BI
- Creating Dataflows for cleaning and transforming data.
- Implementing Sensitivity labels to classify and protect sensitive data.
- Using Datamarts for centralizing data and improving data management.
- Enforcing data quality standards with Endorsement.
- Monitoring data assets with Discovery.
- Implementing data privacy and security with Power BI Premium.
- Improving report refresh times and performance with Power BI Premium.
- Sharing reports and dashboards with a larger audience with Power BI Premium.
- Utilizing Power BI Premium’s increased capacity for large datasets.
- Improving collaboration and data sharing with Power BI Premium’s multi-user authoring feature.
Video talking about Building a Data Governance Plan for Your Power BI Environment.
Conclusion:
Data governance is an essential aspect of data management, helping organizations to ensure that their data is accurate, secure, and accessible. Power BI provides several features to help organizations implement data governance, including Power BI Premium, dataflows, and Datamarts. With these features, organizations can automate collecting and transforming data, reduce the risk of manual errors, and maintain compliance with legal and regulatory requirements. Whether you’re just starting to explore Power BI or are already using it to manage your data, implementing data governance is a crucial step toward effective data management.
It’s very interesting to look at the Power BI adoption roadmap.
Matthew Roche’s Blog from Microsoft is a massive reference to Data Culture and Governance. This guy explains everything about Dataflows here.
If you have any questions discussed in this post or need help, feel free to contact me at this link.
That’s it for today!